Hi there , and welcome to phase two , part one of my project where I'll be introducing some new stuff including data on the forwards of the Vancouver Canucks. I've backtracked from day one of the season and have now watched and tracked every game twice, yes , including the 1-0 road win in Minnesota. For the forwards , I've tracked zone entries and primary shot attempt assists at even strength and on the power-play. In addition , while I went back in time , I figured I may as well track "team exits" (Uncontrolled and Controlled) for the defencemen. I'll go into more detail on the latter when we get there , but for now , let's dive into the new data.
How's your eye test/ Memory?
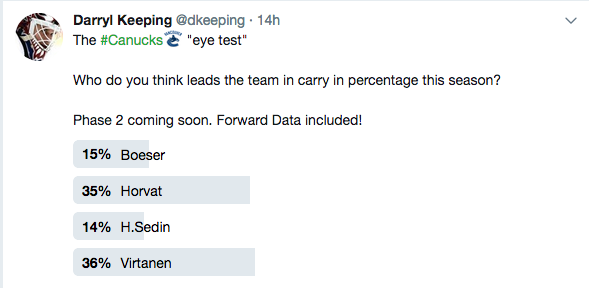
Well , 86% of you were wrong , and so was I. When I started tracking entries I predicted the same thing as the poll results , I thought it would be between Horvat and Virtanen. It's understandable given that Horvat has carried the puck in twice as much as Henrik has , but Bo also dumped it in three times the amount as the captain. Leaving us here , at 5v5 , Henrik Sedin is leading the way carrying the puck into the offensive zone 65.71% of the time. Trailed by Brock Boeser at 63.89% , Horvat at 60.76% , and Virtanen at 56.92% .
Even a trained and practiced eye test can be wrong from time to time and that's okay, quite frankly, thousands of events happen at an incredibly fast pace during a hockey game and it's impossible to remember them all.
Even a trained and practiced eye test can be wrong from time to time and that's okay, quite frankly, thousands of events happen at an incredibly fast pace during a hockey game and it's impossible to remember them all.
Isn't it great that some crazy guy decided to track a large portion of these events to arm the Canucks fans to minimize the hot takes? That being said , this data isn't here to form your opinions , it's here to support them. Let's take a look at all the forwards carry in rates so far this season. You'll likely discover another surprise or two.
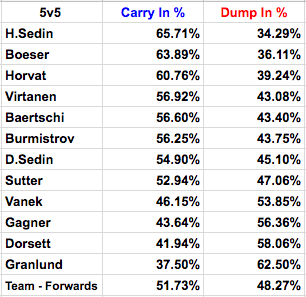
I didn't expect Granlund to be trailing the pack carrying the puck into the offensive zone at a team low rate of 37.50% . Mind you , he's been playing the majority of the season with Dorsett by his side and one of his strengths is puck retrieval which is likely a large factor. His sample away from Dorsett is too small to consider.
To be honest, I was also surprised that Virtanen doesn't have a higher carry in percentage. I feel like he's flying into the offensive zone at will , my eye test seems to have a bias that favors speed and judging from the poll results , I'm not alone on this one.
Bringing us back to the biggest surprise, Henrik leading the team. It's an incredibly encouraging sign that Henrik is still entering the zone with control at a high rate at 5v5. If you're here , you likely already know that there's been extensive research done on zone entries which proves that scoring opportunities are created sooner and more often when you carry the puck in opposed to dumping it in , and if you didn't , now you do. I'll post some links at the bottom of this article if you'd like to take a deeper dive into the science of zone entries. That being said , this isn't the only positive sign that the twins aren't far away from contributing a little more offensively. Let's take a quick look at some other positive signs for the twins and JV18!
The odd trio of the twins and Virtanen is admittedly in it's infancy , but the hypnotizing deception of Daniel and Henrik is currently being complimented perfectly by the combination of speed and power from the former 6th overall pick , Jake Virtanen. Let's take a quick look at how they've performed together, stats courtesy of corsica.hockey

A small sample to be sure , but it's clear with these numbers that this line is taking full advantage of their sheltered opportunities. It's worth mentioning that this line is generating more CF per minute than the Killer Bee's line at the moment. 13 games in , the points aren't there but there is some underlying stats and data that suggests a slight increase in scoring production in the future. We'll notice some other positive trends regarding these three , but I want to move on to why most of you are probably here.
Let's take a look at how Brock Boeser's stacking up against some established elite players in the NHL. Buckle up !
First , let's take a look at how many individual shot attempts he's generating per 60 minutes played this season. Again , stats courtesy of the amazing corsica.hockey
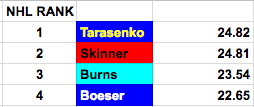
Unfortunately , my chart skills aren't as impressive as Boeser's ability to find shooting opportunities for himself. It's clear the 20 year old rookie isn't shy to showcase his shooting capability. Taking a whopping 22.65 shot attempts per 60 minutes played , good for fourth in the NHL this season.
Brock Boeser completes the hat trick!#Canucks pic.twitter.com/16TtAxrNNs
— Ryan Biech (@ryanbiech) November 5, 2017
It's one thing to have an incredible shot release , it's an entirely separate attribute to have the hockey sense and offensive awareness to find the scoring lanes and execute at a rate worthy of the top five in the NHL.
What's going to make Boeser an elite offensive weapon is that he's proving early on that he's not one dimensional in the offensive zone. Brock is showing that in addition to finding shooting lanes for himself , he can consistently set-up his teammates for shooting opportunities. Let's take a look at how well he's distributing the puck. The following chart is how many primary shot attempt assists each Canuck forward is producing per 60 minutes played at 5v5.
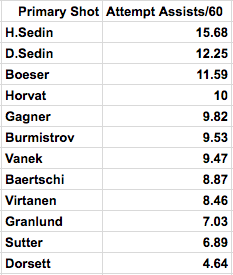
See, I told you the Sedins are making the most of their time. This is intended to be a "team" data release , which it is , but we're going to primarily focus on Brock Boeser for now because what he's doing is impressive. So he's third on the team at setting up his teammates for shot opportunities " big deal " you say? However, this is when you should start to get really excited. When we combine Boeser's shot attempts and primary shot attempt assists and start comparing him to some of the top performers in the NHL from last season , we're putting a strong case together that suggests what Brock is producing is more sustainable than you might think. Lets take a look.
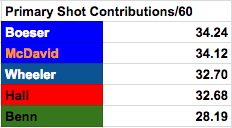
McDavid, Wheeler, Hall , Benn samples provided by Ryan Stimpson and his passing project, numbers are from 2016-2017 season.
Boeser's numbers are a combination tracked by myself and corsica.hockey and from 2017-18 season.
To be clear , I'm not suggesting Boeser is going to produce like Connor McDavid because he won't. I just wanted to show you guys that even if he inevitably regresses a bit , Brock is still going to be among the leagues elite regarding creating shot opportunities for himself and his teammates. Be excited folks , Boeser is the real deal!
Now we'll shift back to more of a team focused approach. The next chart will be primary shot contributions ( Shot attempts + primary shot attempt assists ) per 60 minutes played.
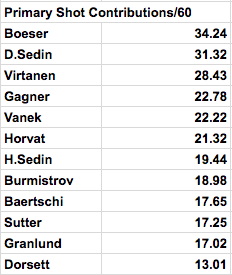
To me, this chart could be the most interesting I've created for the forwards. Unfortunately , Sven Baertschi is the one who sticks out to me for the wrong reasons. It's difficult to comprehend how he's only managing to produce more shooting opportunities than Sutter , Granlund, and Dorsett. I have a feeling he'll improve here , hopefully sooner than later.
Sorry Dorsett , but here's some more evidence your offensive outburst may not be sustainable. If the 30% shooting percentage is sustainable or not , it's been fun to watch.
Henrik and his refusal to shoot becomes transparent here. He's first on the team by a large margin setting up opportunities , then drops to 7th on the team when we combine shooting + passing. Watching him pass up premium shooting chances becomes comedic at times , but that's one of the reasons we love him , right?
Jake Virtanen and Daniel Sedin are producing attempts at an incredible rate in their limited minutes. I'm comfortable with them in their offensive zone exclusive role , but this is another indicator that an additional minute or two per game won't overwhelm them. Or, is it more of an indication of Travis Green and his masterful player deployment? You decide.
Alright , I don't want to be the first person to kill anyone with a hockey chart so I've decided to split phase two of this project into multiple parts. In phase two we'll get into the additional data I went back and tracked which paints a more complete picture on how the Canucks defencemen are contributing to getting the puck out of the defensive zone. I've also tracked some power-play data that we'll dive into.
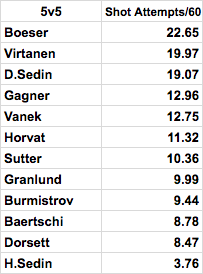
Here's one more chart , this information is provided by corsica.hockey. Shot attempts per 60 minutes played.
c
Remember , Boeser is 4th in the league in this category so what Virtanen and Daniel are doing is pretty special in it's own right.
Just a thought , but I wonder how many other teams have their second and third most likely players to attempt a shot on their fourth line ?
That's it for now people , thanks for stopping by. I hope it was informative. If you have any questions , suggestions , or comments please don't hesitate to reach me on twitter , my inbox is always open. Please remember that this project is primarily fueled by passion so your likes , retweets , and mentions are greatly appreciated. Again , a special thank you to the people who have donated
As promised, here's a link with some information on zone entries that may interest you.
hockey-graphs.com/2016/08/03/tactalytics-using-data-to-inform-tactical-neutral-zone-decisions/
